Grafana and Loki are often used as a log processing and visualization strategy in production deployments, but there are advantages to running them in local container environments as well. Using promtail and the service discovery feature makes integration of Loki a seamless process for common docker configurations.
Promtail configuration
Promtail is used to forward logs from docker containers to Grafana Loki. Before starting the services, let's review the configuration for promtail in more detail:
scrape_configs:
  - job_name: docker_logs
    docker_sd_configs:
      - host: unix:///var/run/docker.sock
        refresh_interval: 10s
        filters:
          - name: label
            values: ["logger=loki"]
    relabel_configs:
      - target_label: 'job'
        replacement: 'docker'
      - source_labels: ['__meta_docker_container_name']
        regex: '/(.*)'
        target_label: 'container'
      - source_labels: ['__meta_docker_container_log_stream']
        target_label: 'stream'
positions:
  filename: /tmp/positions.yaml
clients:
  - url: http://loki:3100/loki/api/v1/push
server:
  http_listen_port: 9080
  grpc_listen_port: 0
If you already have a loki instance running, you can change the client url to point at that server instead. The scrape config uses a docker service discover configuration, so that all containers are considered for scraping, even ones started in the future. Instead of providing a static list of containers to scrape logs from, it scrapes logs from all containers that have the label logger=loki, The main advantage of this approach is that it integrates seamlessly with existing and future containers, while still providing control over which container logs are forwarded to loki and which aren't.
The scraped logs are annotated with a few labels, namely container with the name of the container they came from, stream set to either stdout or stderr to identify which output the log message was written to, as well as job=docker to identify the promtail source that forwarded the log message to loki.
Starting the stack
This single docker compose file is all you need to set up the log forwarding:
docker-compose.yml
networks:
  loki-net:
    name: loki-net

services:
  loki:
    image: grafana/loki:latest
    command: -config.file=/etc/loki/local-config.yaml
    networks:
      - loki-net
  grafana:
    image: grafana/grafana:latest
    ports:
      - 127.0.0.1:3000:3000
    configs:
      - source: datasources
        target: /etc/grafana/provisioning/datasources/datasources.yaml
    environment:
      - GF_AUTH_ANONYMOUS_ENABLED=true
      - GF_AUTH_ANONYMOUS_ORG_ROLE=Admin
      - GF_AUTH_DISABLE_LOGIN_FORM=true
    depends_on:
      - loki
    networks:
      - loki-net
  promtail:
    image:  grafana/promtail:latest
    container_name: promtail
    volumes:
      - /var/lib/docker/containers:/var/lib/docker/containers:ro
      - /var/run/docker.sock:/var/run/docker.sock
    configs:
      - source: promtail
        target: /etc/promtail/docker-config.yaml
    command: -config.file=/etc/promtail/docker-config.yaml
    depends_on:
      - loki
    networks:
      - loki-net

configs:
  datasources:
    content: |
      apiVersion: 1
      datasources:
        - name: Loki
          type: loki
          access: proxy
          url: http://loki:3100
          version: 1
          editable: false
          isDefault: true
  promtail:
    content: |
      scrape_configs:
        - job_name: docker_logs
          docker_sd_configs:
            - host: unix:///var/run/docker.sock
              refresh_interval: 5s
              filters:
                - name: label
                  values: ["logger=loki"]
          relabel_configs:
            - target_label: 'job'
              replacement: 'docker'
            - source_labels: ['__meta_docker_container_name']
              regex: '/(.*)'
              target_label: 'container'
            - source_labels: ['__meta_docker_container_log_stream']
              target_label: 'stream'
      positions:
        filename: /tmp/positions.yaml
      clients:
        - url: http://loki:3100/loki/api/v1/push
      server:
        http_listen_port: 9080
        grpc_listen_port: 0
Save the file to a directory, then start it:
docker compose up -dAfter a moment, the grafana interface should be available at http://127.0.0.1:3000. For convenience, the Grafana authentication is disabled and Grafana only listens on localhost so it cannot be used from other machines in the network. Loki and promtail are only available locally to skip most security concerns.
Starting a container with log forwarding
All you have to do to get your container logs forwarded to Loki is to label the container in question with logger=loki:
docker run --rm -d --name nginx-app -l logger=loki nginxWithout any more setup, the container logs will be forwarded to Loki in 5 second intervals.
Checking the logs
To access the stored logs, head over to the Grafana UI at http://127.0.0.1:3000. In the menu on the left, select the "Explore" section and you will be greeted with a blank Loki query builder:
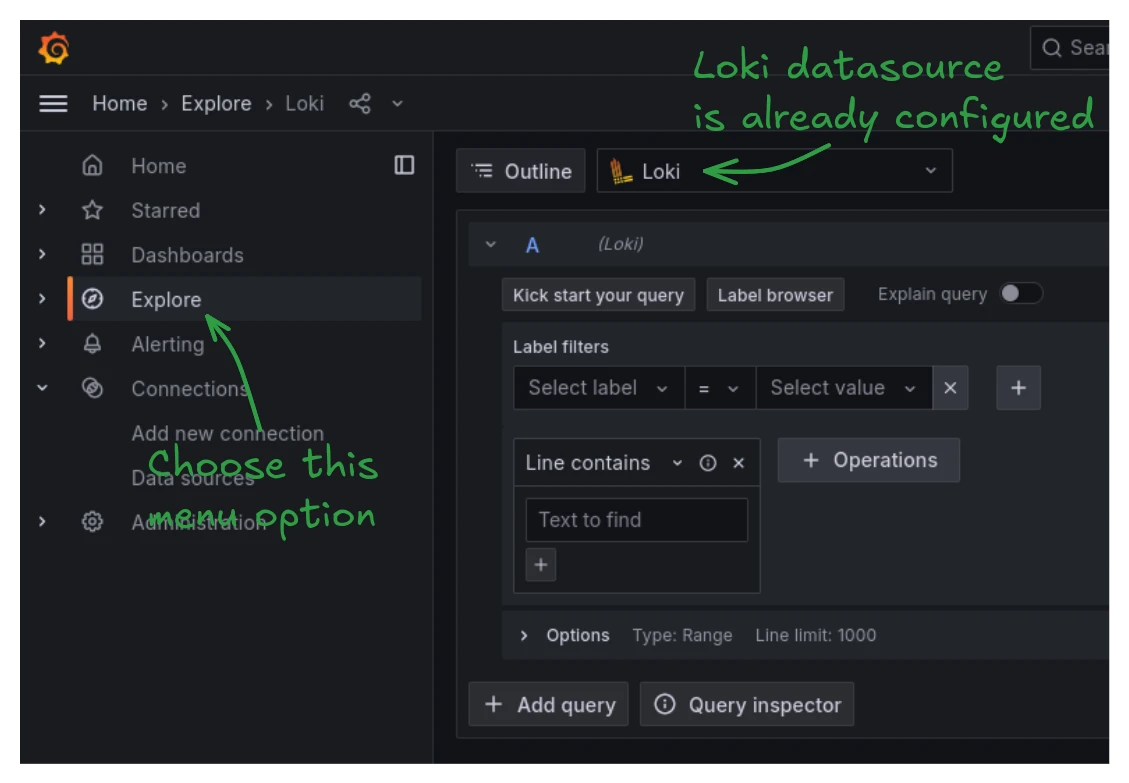
Since the docker-compose.yml already set up the Loki instance as a Grafana datasource, no further configuration s needed. Simply run a query to see logs, for example by filtering for the sample container created earlier:
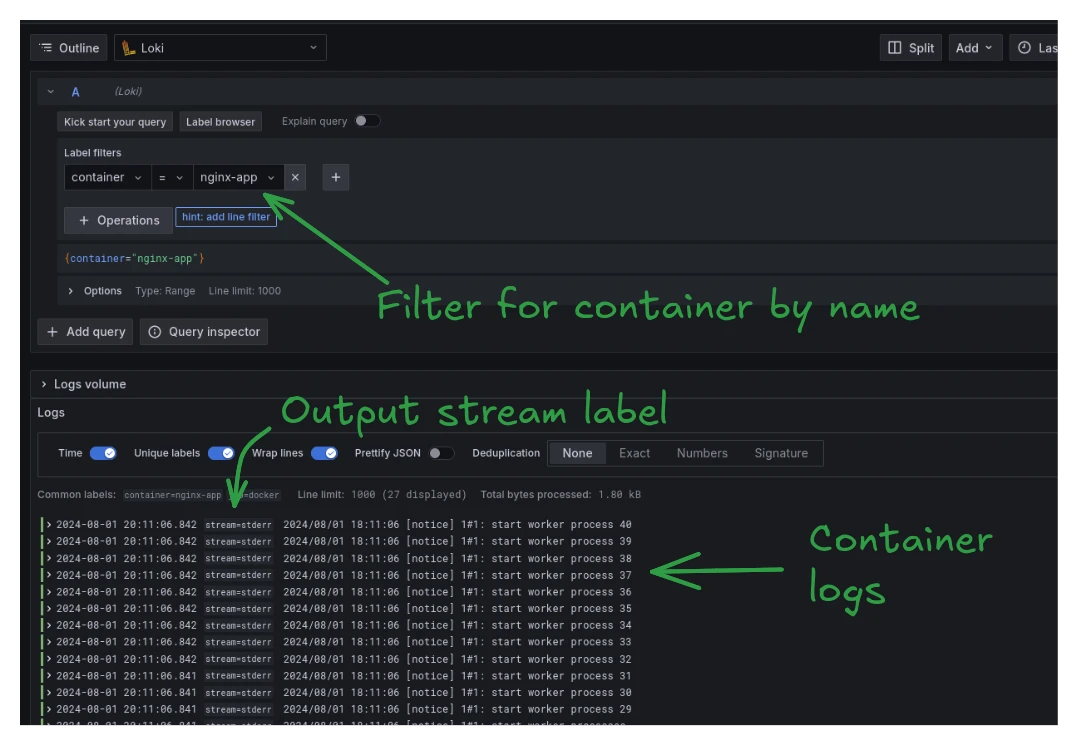
And that's all the necessary steps! Any container labeled logger=loki will now automatically work with this setup.