When bugs make it into production systems, they can cause long service outages and maintenance downtime, often taking considerable time to resolve. In such situations, it is vital to have historic data of the service and it's components, to see what changed between the faulty version and the last working one. This is where monitoring products like Prometheus come in: they continuously collect metrics of your choice, store them for some time and make them available through the PromQL query language. While such setups can quickly get complex, today we will look at a simpler version to monitor a server and it's docker containers.
Exposing server metrics
The most basic thing to monitor is of course the host server itself. What exactly to watch out for can be difficult to answer, so it is common practice to look out for the common cpu, memory, network and disk metrics, but also less obvious ones, such as available entropy on the system and time synchronization. The tool most commonly used to expose this data to prometheus is node_exporter, a lightweight http server maintained by the prometheus team that will fetch and expose this and more information. You can run their docker container image prom/node-exporter without much setup:
docker run -d -p 127.0.0.1:9100:9100 -v /proc:/proc --name mon_node-exporter prom/node-exporterThe container can read the host's usage metrics because we mounted the /proc directory into it. Note that the port 9100 is forwarded only for requests from 127.0.0.1. This is intentional: Usage metrics may contain sensitive information, so they should be treated with care. In a single-machine setup it is likely enough to only expose them to localhost, but in larger setups you will need to add further steps, like authentication and encrypting the network traffic with TLS.
To test your server metrics, you can quickly open http://127.0.0.1:9100 in your browser. You should see a welcome page like this:
If you click the "Metrics" link, you can see the raw metrics that prometheus will later retrieve and store for you.
Exposing docker container metrics
The second monitoring target are the docker containers running on the server. We will go with google's battle-tested cadvisor here. While cadvisor can do much more than collect container statistics, and even run as a standalone tool, we aren't interested in those features. Since this is a common usage scenario, cadvisor provides the --docker_only flag, to restrict it's monitoring to docker components exclusively. To further decrease it's system load, we also set the housekeeping interval to 30 seconds, as the default of 10-15 seconds can be exhausting for low-medium range servers. The full command to get it running is
docker run -d \
   -v /:/rootfs:ro \
   -v /var/run:/var/run:ro \
   -v /sys:/sys:ro \
   -v /var/lib/docker:/var/lib/docker:ro \
   -v /dev/disk:/dev/disk:ro \
   --device /dev/kmsg \
   --privileged \
   -p 127.0.0.1:8080:8080 \
   --name mon_cadvisor \
   gcr.io/cadvisor/cadvisor:v0.47.2 --docker_only=true --housekeeping_interval=30s
While this may look complex, it really isn't. We simply mounted a lot of directories into the container, give it acess to /dev/kmsg and expose it at http://127.0.0.1:8080.
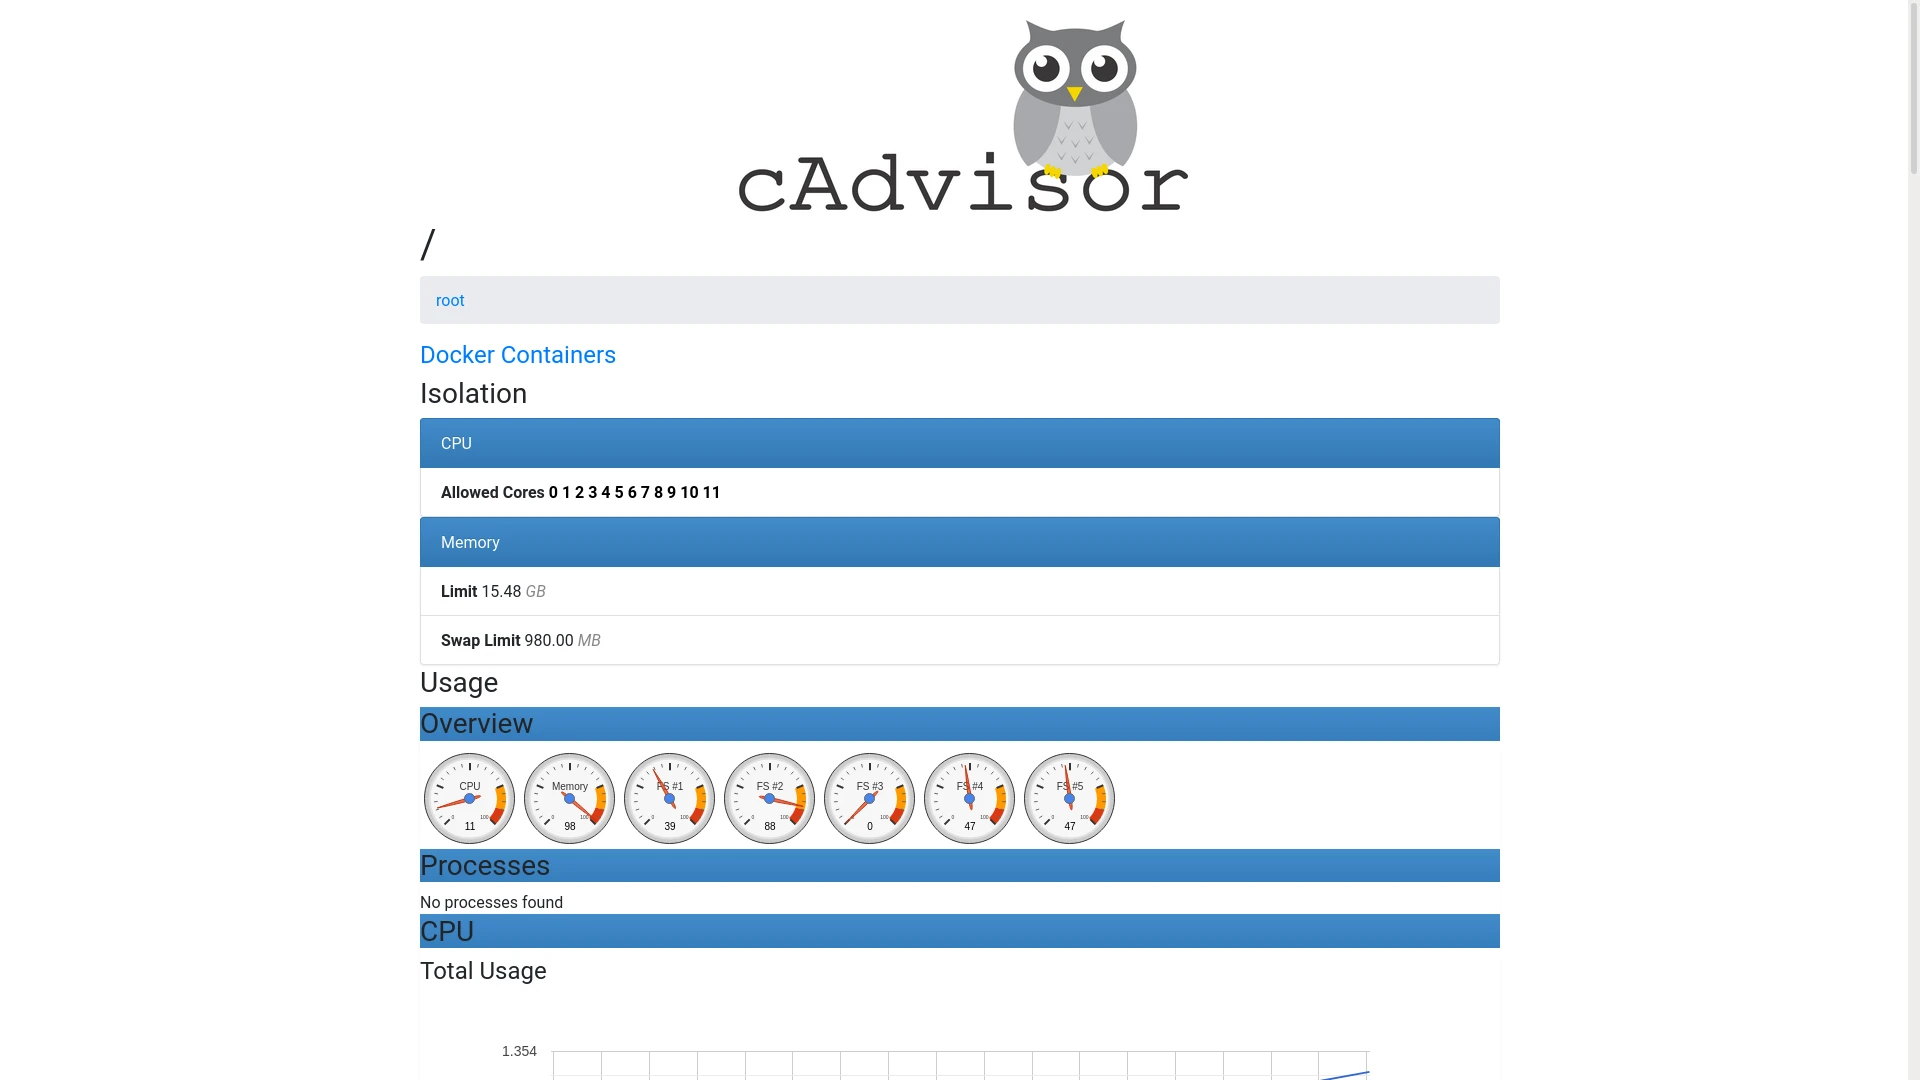
You can check cadvisor's interface with your web browser, just like node_exporter earlier. Cadvisor has a nicer user interface on it's own, providing information about each running container, as well as total metrics for all containers combined:
Retrieving and storing metrics with prometheus
Now that all metrics are available, it is time to retrieve and store them with prometheus. To do this, we first need a configuration file, specifying our endpoints:
prometheus.yml
global:
 scrape_interval:    15s # Set the scrape interval to every 15 seconds. Default is every 1 minute.
 evaluation_interval: 15s # Evaluate rules every 15 seconds. The default is every 1 minute.
 external_labels:
     monitor: 'docker-monitoring-test'
scrape_configs:
   # host node stats
 - job_name: 'node_exporter'
   static_configs:
     - targets: ["127.0.0.1:9100"]
   # docker container stats
 - job_name: 'cadvisor'
   static_configs:
     - targets: ["127.0.0.1:8080"]
This configuration simply instructs prometheus to collect our node_exporter and cadvisor data every 15 seconds. Now start a container with this configuration file:
docker run -d -v $PWD/prometheus.yml:/etc/prometheus/prometheus.yml --name mon_prometheus --network host prom/prometheusIf you followed the previous steps, you should now have a prometheus instance running on http://127.0.0.1:9090/, with data from both node_exporter and cadvisor:
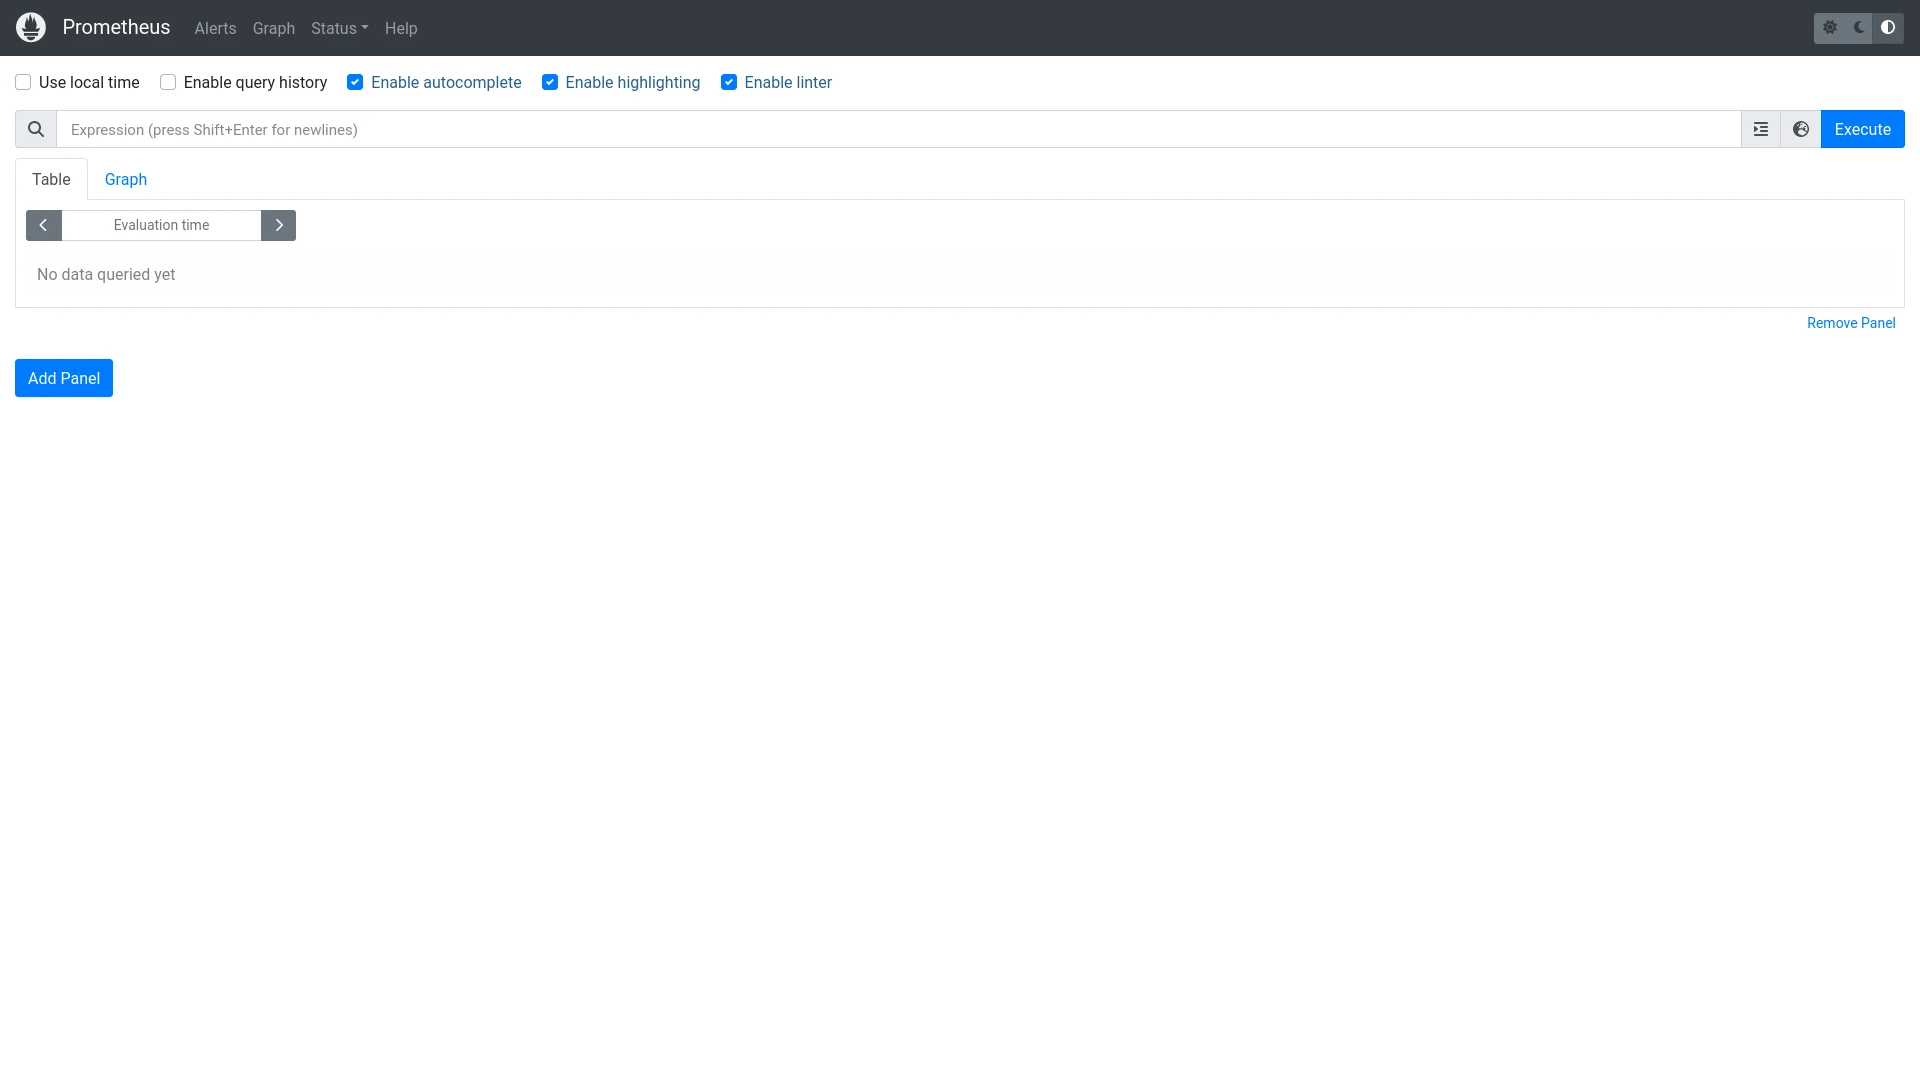
Note that this instance is ephemeral; if you want to persist monitoring data on the host, you will need to mount the container directory /prometheus to some host path.
Visualization with Grafana
While prometheus has some visualization capabilities itself, Grafana is a much more mature and feature-rich alternative for this task. Setting it up is trivial:
docker run -d --network host --name mon_grafana grafana/grafanaHeading over to http://127.0.0.1:3000, you should see Grafana's login screen:
Log in with username admin and password admin. You can change login credentials if you want, but they won't be persisted. If you want to persist Grafana's data, you need to mount the container directory /var/lib/grafana somewhere on the host.
To use the prometheus metrics, we first need to tell Grafana about our Prometheus instance. We do this by navigating to Menu > Connections and selecting Prometheus from the list. In the configuration screen, make sure to provide http://127.0.0.1:9090 for the field "Prometheus server URL":
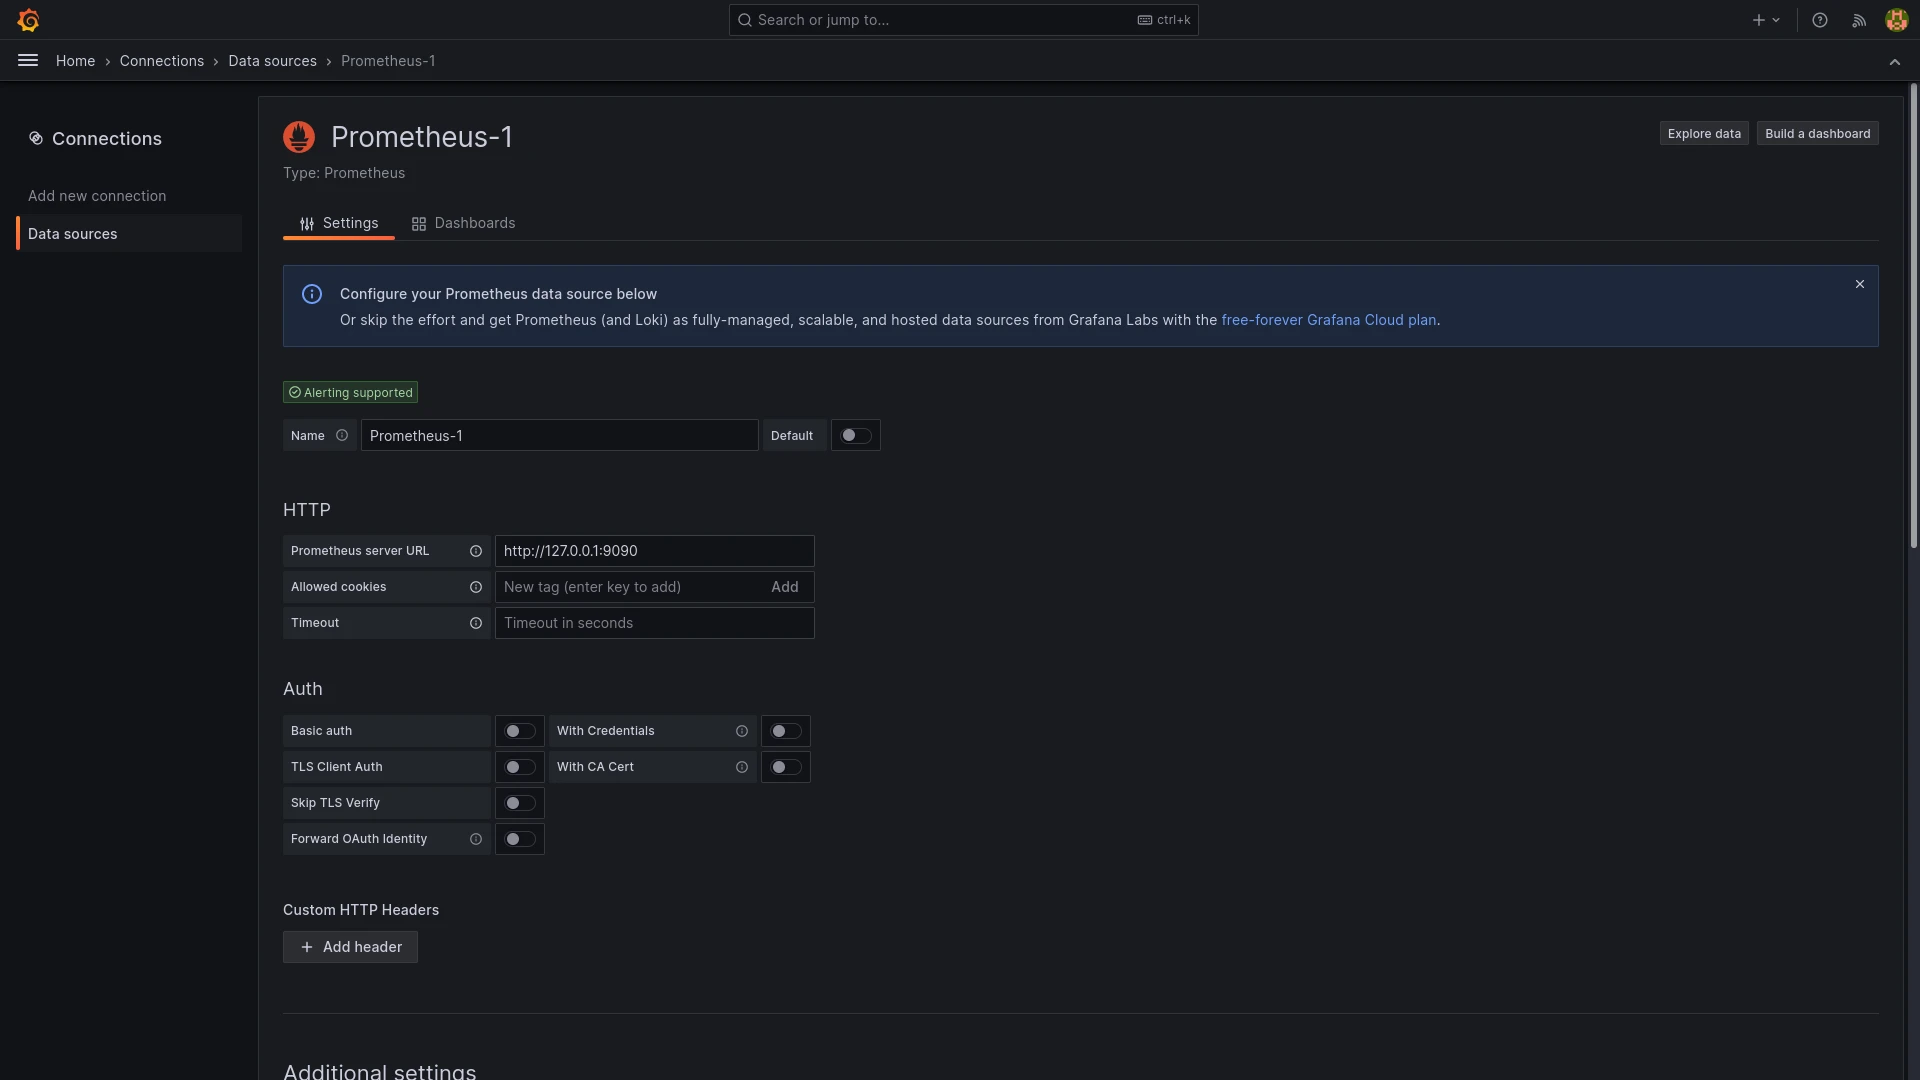
Now click the "Save & Test" button at the bottom.
While we could create our own custom dashboards with the data source set up, there are already great ready-made ones by the community for our use case:
Node Exporter Full with ID 1860 and Docker monitoring with ID 193. You can import a dashboard by clicking in the search bar at the top and selecting "Import dashboard". In the setup window, type the ID of the dashboard you want into the "Import via grafana.com" field and click the "Load" button on the right. Finally, select your prometheus data source in the "Prometheus" field at the bottom and click "Import".
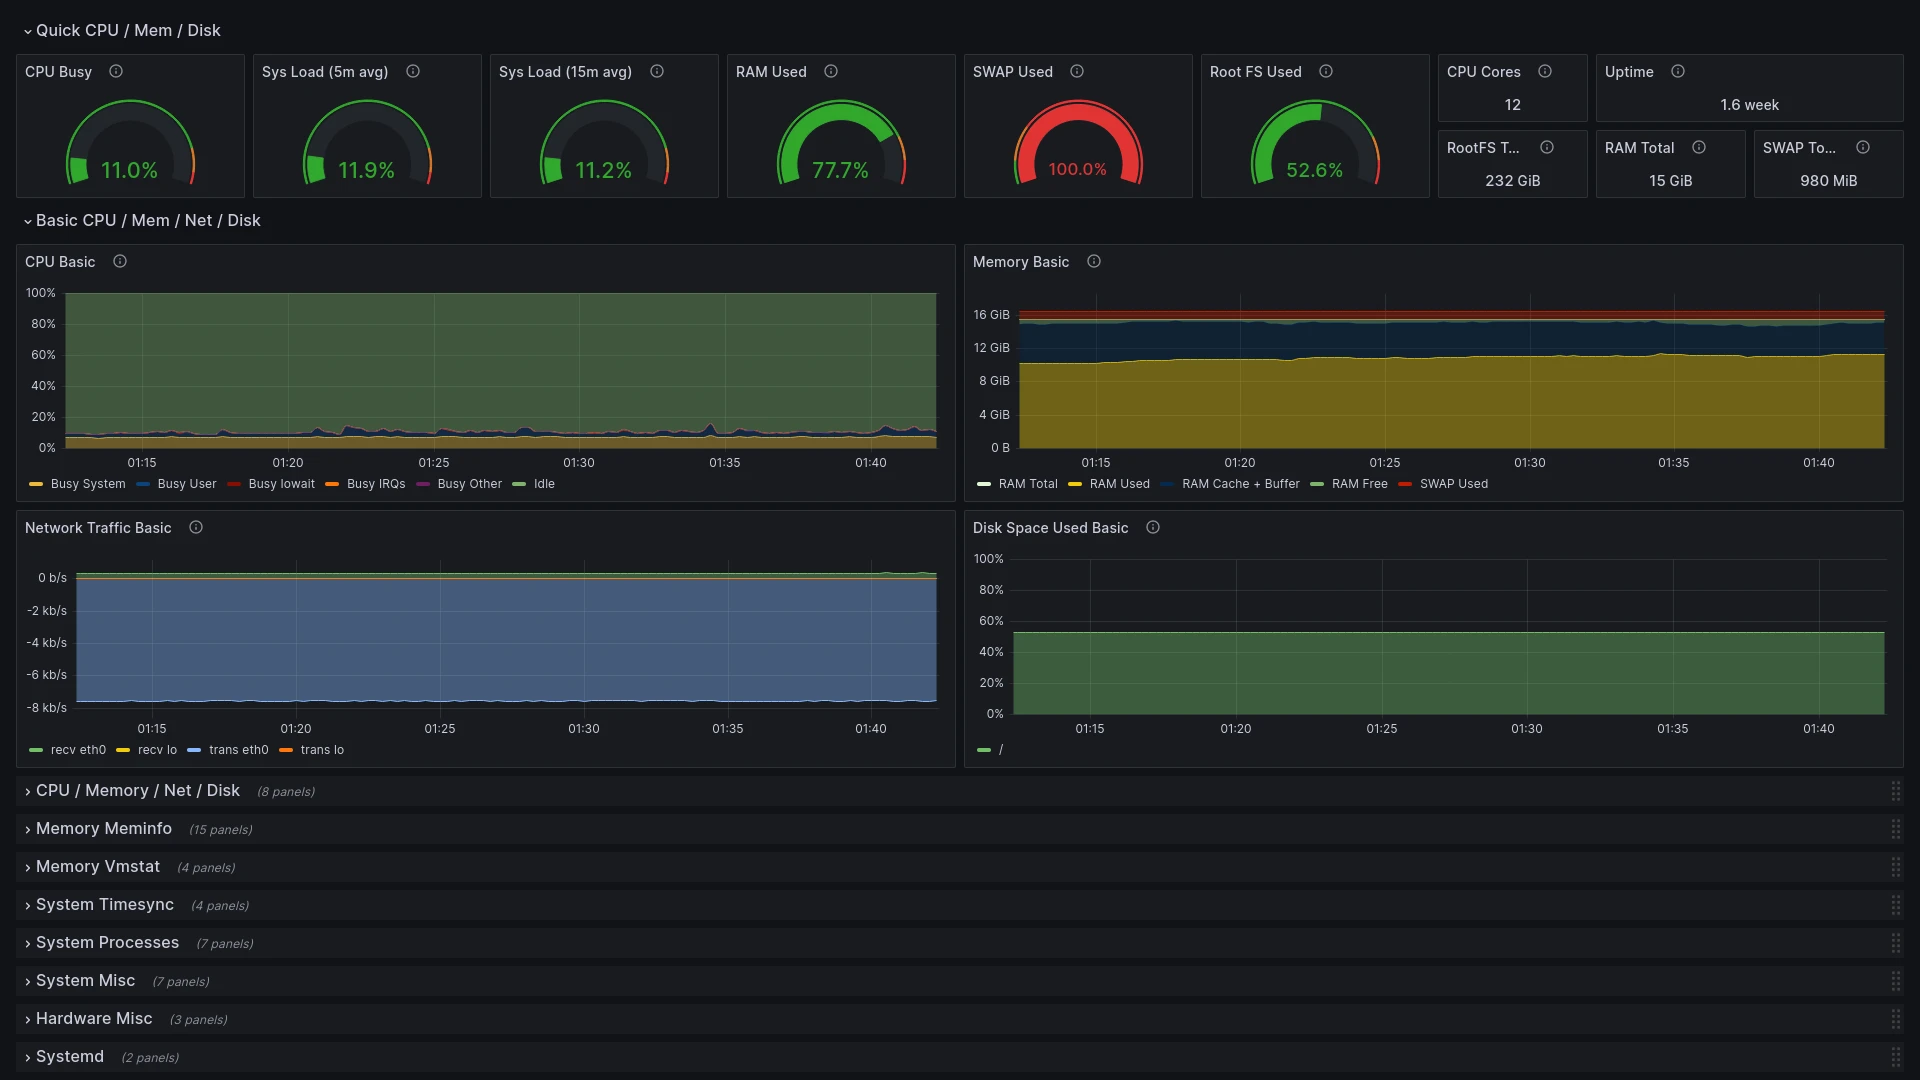
After doing these steps for both dashboards, you should now have complete dashboards for your host metrics:
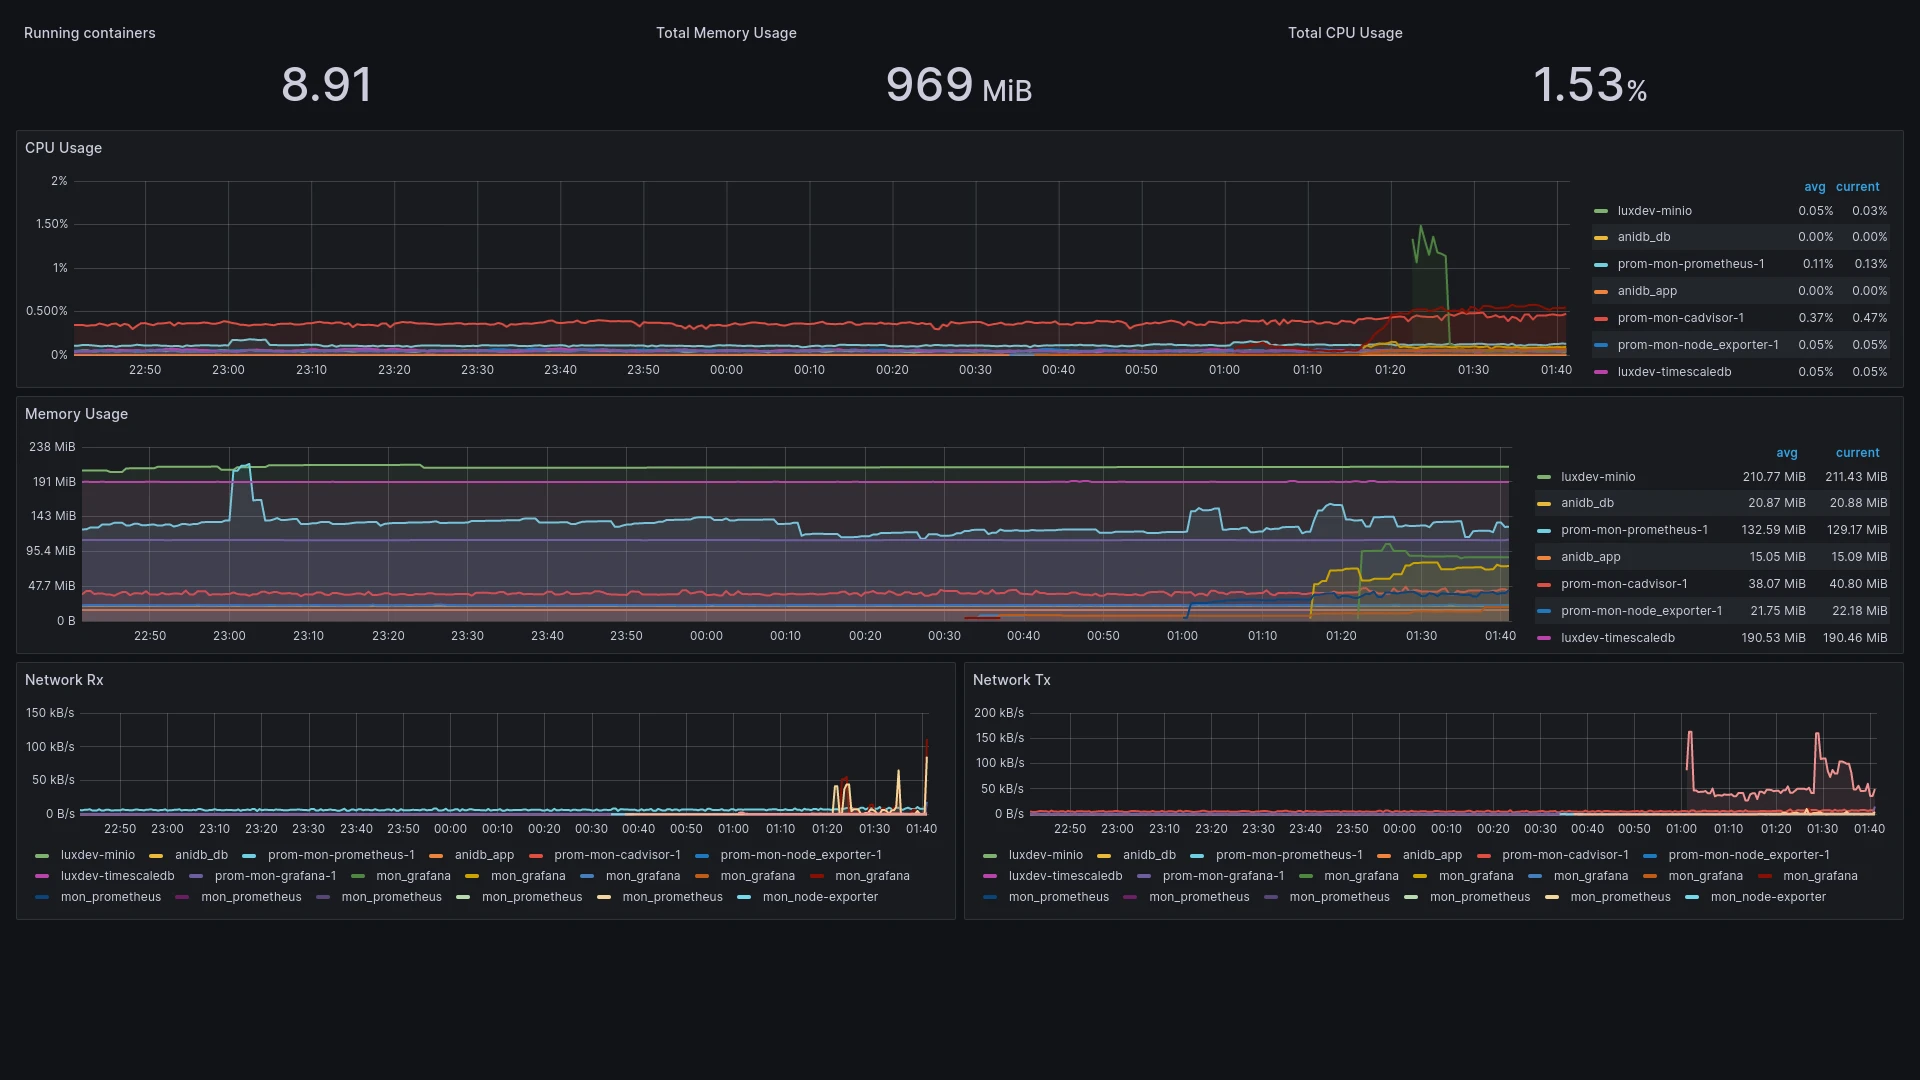
And your docker containers:
Automated docker-compose setup
Since this process can be time-consuming, it is a good idea to automate it as much as possible. Docker-compose is just the right tool for this job:
docker-compose.yml
version: "2.4"
services:
 prometheus:
   image: prom/prometheus
   mem_limit: 2g
   cpus: 2.0
   volumes:
     - $PWD/prometheus.yml:/etc/prometheus/prometheus.yml
     - $PWD/volumes/prometheus:/prometheus
 node_exporter:
   image: prom/node-exporter
   volumes:
     - /proc:/proc
   mem_limit: 2g
   cpus: 2.0
 cadvisor:
   image: gcr.io/cadvisor/cadvisor:v0.47.2
   mem_limit: 2g
   cpus: 2.0
   privileged: true
   command:
     - "--docker_only=true"
     - "--housekeeping_interval=30s"
   volumes:
     - /:/rootfs:ro
     - /var/run:/var/run:ro
     - /sys:/sys:ro
     - /var/lib/docker/:/var/lib/docker:ro
     - /dev/disk/:/dev/disk:ro
   devices:
     - /dev/kmsg:/dev/kmsg
 grafana:
   image: grafana/grafana
   mem_limit: 2g
   cpus: 2.0
   ports:
     - 9090:3000
   volumes:
     - $PWD/volumes/grafana:/var/lib/grafana
This is the setup above, with some minor adjustments: All services are running in an internal network, with only Grafana exposed on port 9090 (to prevent it from conflicting with other services running on port 3000). All containers got a maximum of 2 cpu cores and 2gb of memory and prometheus/grafana data is persisted to mounted host directories.
To use this file, you need to create the directories volumes/prometheus and volumes/grafana and ensure they are writable.
mkdir -p volumes/{prometheus,grafana} && chmod -R 777 volumesFinally, the prometheus.yml file needs to be adjusted to use the internal container names instead of localhost ip addresses to resolve the container targets:
prometheus.yml
global:
 scrape_interval:    15s # Set the scrape interval to every 15 seconds. Default is every 1 minute.
 evaluation_interval: 15s # Evaluate rules every 15 seconds. The default is every 1 minute.
 external_labels:
     monitor: 'monitoring-test'
scrape_configs:
   # host node stats
 - job_name: 'node_exporter'
   static_configs:
     - targets: ["node_exporter:9100"]
   # docker container stats
 - job_name: 'cadvisor'
   static_configs:
     - targets: ["cadvisor:8080"]
Now all you have to do to get the entire monitoring stack running is a simple
docker-compose up -d