Kubernetes is a great platform to deploy and maintain applications in production, but keeping track of all the resources in a growing cluster can be challenging. To aid in maintaining a birds-eye overview of the entire cluster contents, the kubernetes dashboard can be installed in the cluster for a visualized and structured web ui of the cluster resources, state and configuration.
Installing the dashboard
The kubernetes dashboard requires the metrics-server to accurately display resource usage and statistics. While some distributions like K3s will install this by default, cloud-hosted solutions like GKE or EKS will typically not.
You can check if you have the metrics-server installed by running
kubectl get deployment metrics-server -n kube-systemIf this returns a NotFound error, you will need to install it with
kubectl apply -f https://github.com/kubernetes-sigs/metrics-server/releases/latest/download/components.yamlNow verify that the installation has created the dashboard resources and metrics scraper in the kubernetes-dashboard namespace:
kubectl get all -n kubernetes-dashboardThe output should look similar to this:
NAME                                            READY  STATUS   RESTARTS  AGE
pod/dashboard-metrics-scraper-5cb4f4bb9c-pp4n5  1/1    Running  0         100m
pod/kubernetes-dashboard-6967859bff-rw2kz       1/1    Running  0         100m

NAME                               TYPE       CLUSTER-IP     EXTERNAL-IP  PORT(S)   AGE
service/dashboard-metrics-scraper  ClusterIP  10.43.230.188  <none>       8000/TCP  100m
service/kubernetes-dashboard       ClusterIP  10.43.30.79    <none>       443/TCP   100m

NAME                                       READY  UP-TO-DATE  AVAILABLE  AGE
deployment.apps/dashboard-metrics-scraper  1/1    1           1          100m
deployment.apps/kubernetes-dashboard       1/1    1           1          100m

NAME                                                  DESIRED  CURRENT  READY  AGE
replicaset.apps/dashboard-metrics-scraper-5cb4f4bb9c  1        1        1      100m
replicaset.apps/kubernetes-dashboard-6967859bff       1        1        1      100m
Setting up dashboard authentication
To access the web interface, we first need a ServiceAccount with the cluster-admin role to authenticate as. You can create a sample user and the role binding with a single file:
dashboard-account.yml
apiVersion: v1
kind: ServiceAccount
metadata:name: admin-usernamespace: kubernetes-dashboard
---
apiVersion: rbac.authorization.k8s.io/v1
kind: ClusterRoleBinding
metadata:name: admin-user
roleRef:apiGroup: rbac.authorization.k8s.iokind: ClusterRolename: cluster-admin
subjects:
- kind: ServiceAccountname: admin-usernamespace: kubernetes-dashboard
Save the file locally and apply it to your cluster with
kubectl apply -f dashboard-account.ymlTo verify that the user was created correctly, run
kubectl get serviceaccounts -n kubernetes-dashboardand ensure that the admin-user account is listed.
Accessing the web ui
To access the web interface of the dashboard, we first need an authentication token to log in. You can retrieve one with the command:
kubectl create token admin-user -n kubernetes-dashboardCopy the entire output of this command, you will need it in a moment. Note that this bearer token is usually temporary, so it will become invalid after roughly 1 hour, at which point you will need to get a new one to log in again.
The dashboard is now deployed internally. While we could expose it through a Service or Ingress, it is often more practical to simply proxy it to a local machine, so the service is not exposed to the entire internet. We use the kubectl proxy command to do this (which is preferred over kubectl port-forward for the kubernetes dashboard, as some features can be faulty with it).
kubectl proxyLeave this window open. As long as the command is running, you can access your dashboard at http://localhost:8001/api/v1/namespaces/kubernetes-dashboard/services/https:kubernetes-dashboard:/proxy/.
You should see a login screen similar to this:
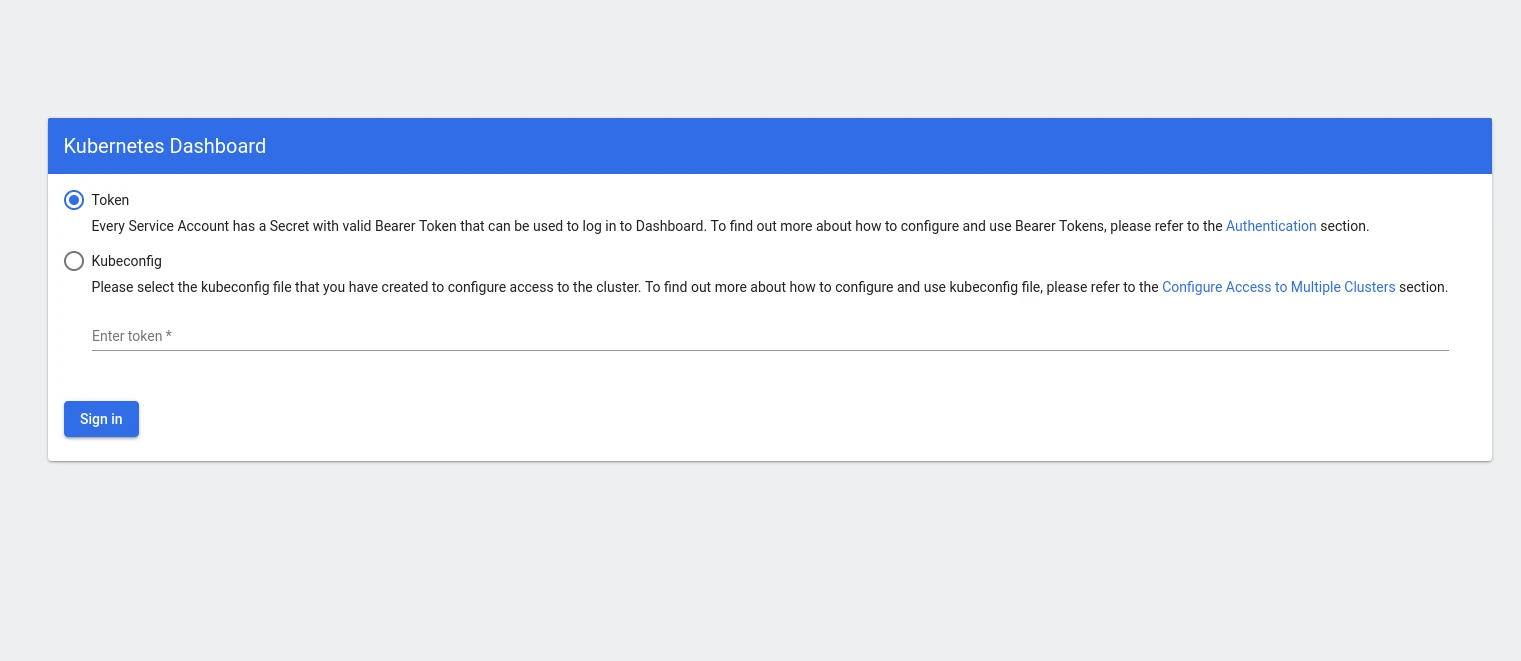
Make sure you select the "Token" authentication option and paste your copied ServiceAccount token into the input field, the click "Sign in".
You now have a working Kubernetes Dashboard installed, with dependencies and authentication setup. The dashboard contains many different views of resources and configurations, and even allows you to change or add new configurations to the cluster.